Demonstration of DataVizML
This notebook will demonstrate the capabilities of the DataVizML library
Import libraries
from datavizml.singledistribution import SingleDistribution
from datavizml.exploratorydataanalysis import ExploratoryDataAnalysis
import matplotlib.pyplot as plt
import numpy as np
import pandas as pd
from sklearn.datasets import load_breast_cancer, load_diabetes, load_iris
Load data
# binary classification dataset
X_binary_classification, y_binary_classification = load_breast_cancer(
    return_X_y=True, as_frame=True
)
X_binary_classification = X_binary_classification.iloc[:, :8]
y_binary_classification = y_binary_classification.astype(bool)

# regression dataset
X_regression, y_regression = load_diabetes(return_X_y=True, as_frame=True)

# create alternative target for classification with large class imbalance
y_regression_class = y_regression > 50

# add time series data field
date_range = pd.date_range(start="2020-01-01", end="2023-12-31", freq="S")
X_binary_classification["time stamp"] = np.random.choice(
    date_range, size=len(X_binary_classification)
)
X_binary_classification.loc[y_binary_classification, "time stamp"] = (
    X_binary_classification.loc[y_binary_classification, "time stamp"]
    - pd.DateOffset(months=12)
)
X_regression["time stamp"] = np.random.choice(date_range, size=len(X_regression))
X_regression.loc[y_regression_class, "time stamp"] = X_regression.loc[
    y_regression_class, "time stamp"
] - pd.DateOffset(months=12)

# multiclass dataset
X_multiclass_classification, y_multiclass_classification = load_iris(
    return_X_y=True, as_frame=True
)
class_map = {k: v for k, v in enumerate(load_iris()["target_names"])}
y_multiclass_classification = y_multiclass_classification.map(class_map)
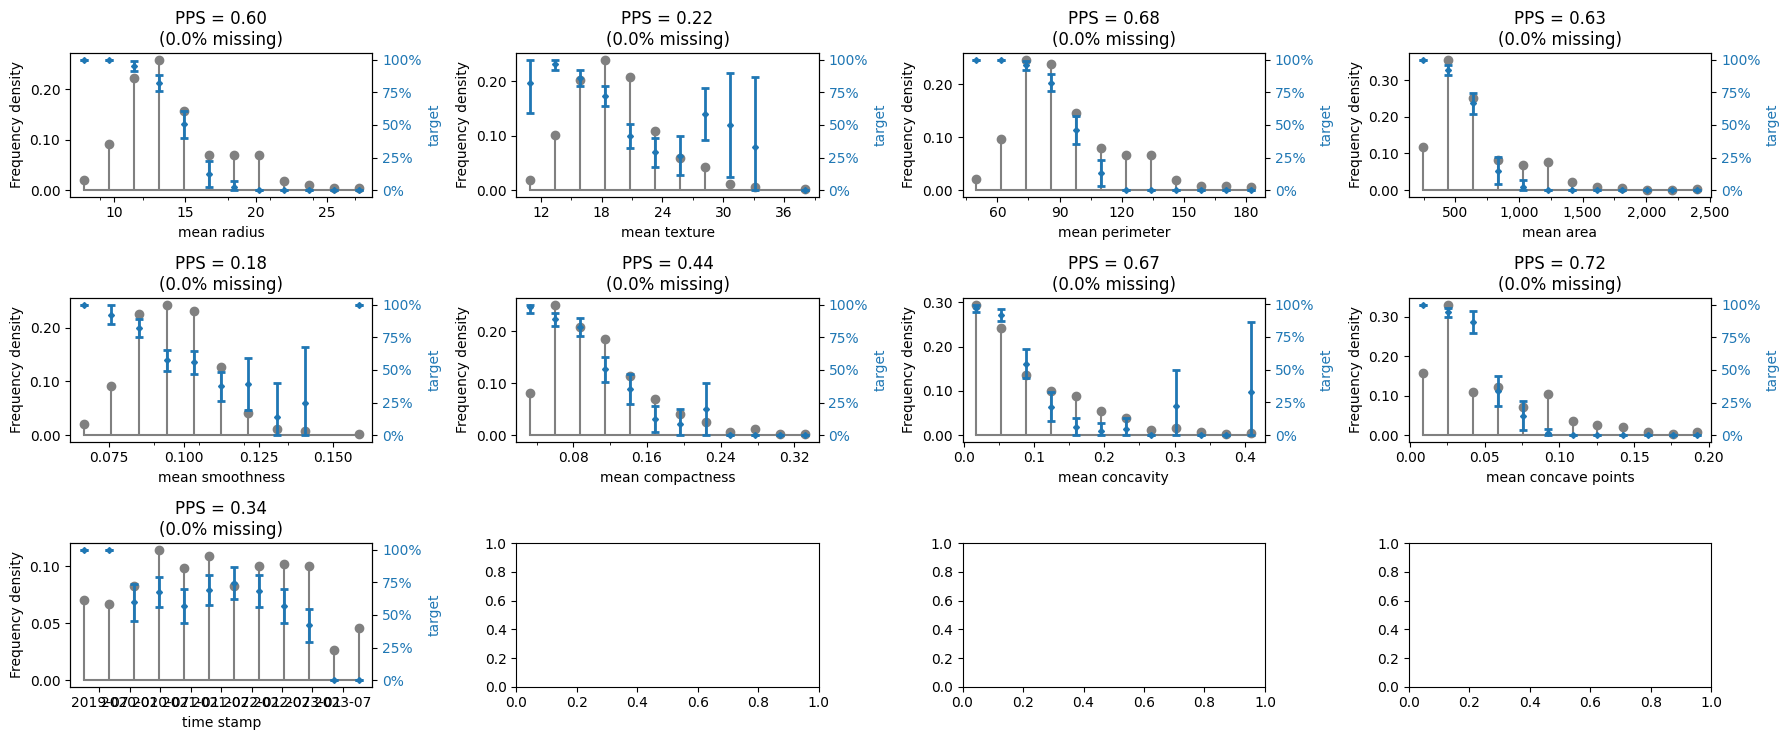
Demonstrate with binary classification
# create and run eda for data and target
eda = ExploratoryDataAnalysis(
    data=X_binary_classification,
    target=y_binary_classification,
    ncols=4,
    figure_width=18,
    axes_height=2.5,
)
fig = eda()

# set figure layout
fig.tight_layout()
/home/docs/checkouts/readthedocs.org/user_builds/datavizml/envs/latest/lib/python3.11/site-packages/pandas/core/arrays/timedeltas.py:908: RuntimeWarning: invalid value encountered in cast
  base = data.astype(np.int64)
/home/docs/checkouts/readthedocs.org/user_builds/datavizml/envs/latest/lib/python3.11/site-packages/pandas/core/arrays/timedeltas.py:912: RuntimeWarning: invalid value encountered in cast
  data = (base * m + (frac * m).astype(np.int64)).view("timedelta64[ns]")
/tmp/ipykernel_637/2607751757.py:12: UserWarning: AutoDateLocator was unable to pick an appropriate interval for this date range. It may be necessary to add an interval value to the AutoDateLocator's intervald dictionary. Defaulting to 6.
  fig.tight_layout()
/home/docs/checkouts/readthedocs.org/user_builds/datavizml/envs/latest/lib/python3.11/site-packages/IPython/core/events.py:82: UserWarning: AutoDateLocator was unable to pick an appropriate interval for this date range. It may be necessary to add an interval value to the AutoDateLocator's intervald dictionary. Defaulting to 6.
  func(*args, **kwargs)
/home/docs/checkouts/readthedocs.org/user_builds/datavizml/envs/latest/lib/python3.11/site-packages/IPython/core/pylabtools.py:170: UserWarning: AutoDateLocator was unable to pick an appropriate interval for this date range. It may be necessary to add an interval value to the AutoDateLocator's intervald dictionary. Defaulting to 6.
  fig.canvas.print_figure(bytes_io, **kw)
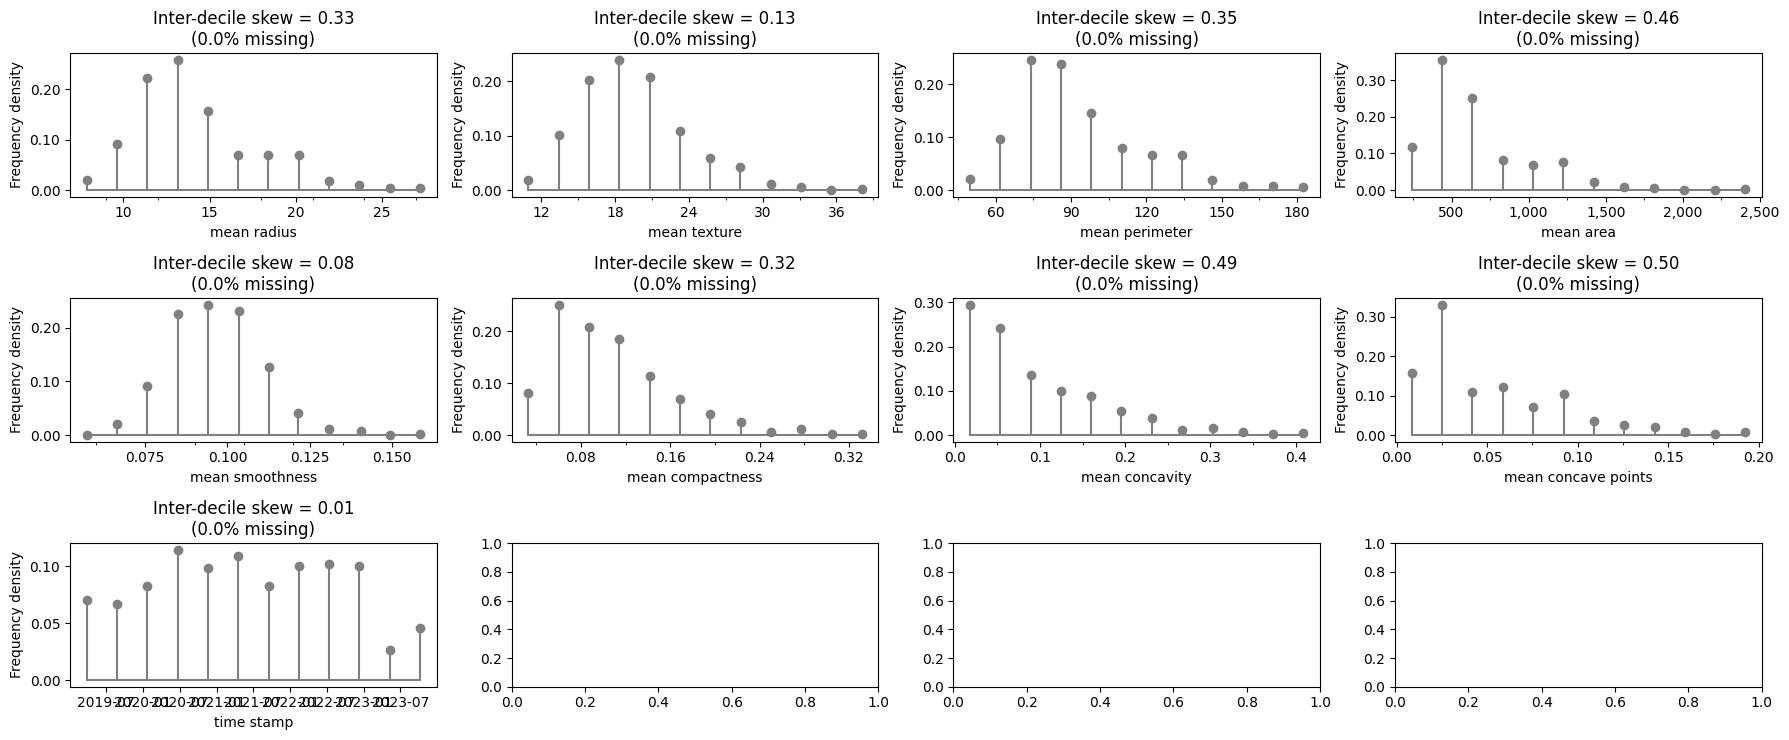
# create and run eda for data and target
eda = ExploratoryDataAnalysis(
    data=X_binary_classification,
    ncols=4,
    figure_width=18,
    axes_height=2.5,
)
fig = eda()

# set figure layout
fig.tight_layout()
/home/docs/checkouts/readthedocs.org/user_builds/datavizml/envs/latest/lib/python3.11/site-packages/pandas/core/arrays/timedeltas.py:908: RuntimeWarning: invalid value encountered in cast
  base = data.astype(np.int64)
/home/docs/checkouts/readthedocs.org/user_builds/datavizml/envs/latest/lib/python3.11/site-packages/pandas/core/arrays/timedeltas.py:912: RuntimeWarning: invalid value encountered in cast
  data = (base * m + (frac * m).astype(np.int64)).view("timedelta64[ns]")
/tmp/ipykernel_637/1227952141.py:11: UserWarning: AutoDateLocator was unable to pick an appropriate interval for this date range. It may be necessary to add an interval value to the AutoDateLocator's intervald dictionary. Defaulting to 6.
  fig.tight_layout()
/home/docs/checkouts/readthedocs.org/user_builds/datavizml/envs/latest/lib/python3.11/site-packages/IPython/core/events.py:82: UserWarning: AutoDateLocator was unable to pick an appropriate interval for this date range. It may be necessary to add an interval value to the AutoDateLocator's intervald dictionary. Defaulting to 6.
  func(*args, **kwargs)
/home/docs/checkouts/readthedocs.org/user_builds/datavizml/envs/latest/lib/python3.11/site-packages/IPython/core/pylabtools.py:170: UserWarning: AutoDateLocator was unable to pick an appropriate interval for this date range. It may be necessary to add an interval value to the AutoDateLocator's intervald dictionary. Defaulting to 6.
  fig.canvas.print_figure(bytes_io, **kw)
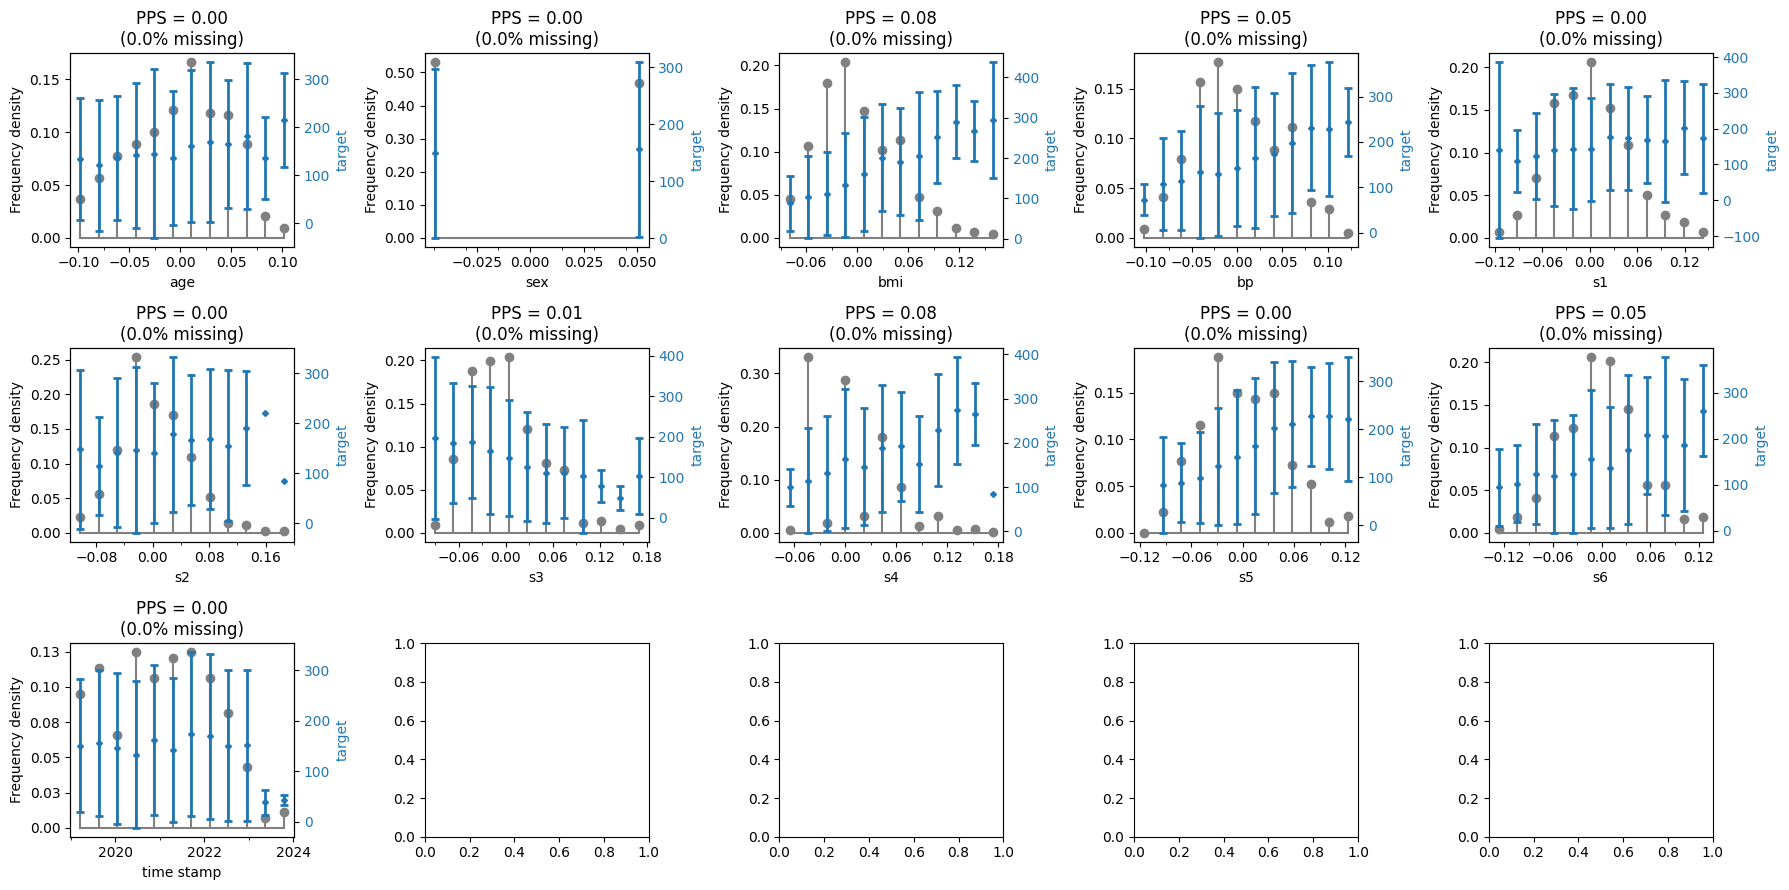
Demonstrate with regression
# initialise figure
ncols = 5
nrows = -(-(X_regression.shape[1]) // ncols)
fig, ax_all = plt.subplots(ncols=ncols, nrows=nrows, figsize=(18, 3 * nrows))

# loop though all features as an array
for (_, x), ax in zip(X_regression.items(), ax_all.flatten()):
    sd = SingleDistribution(feature=x, ax=ax, target=y_regression)
    sd()

# set figure layout
fig.tight_layout()
/home/docs/checkouts/readthedocs.org/user_builds/datavizml/envs/latest/lib/python3.11/site-packages/pandas/core/arrays/timedeltas.py:908: RuntimeWarning: invalid value encountered in cast
  base = data.astype(np.int64)
/home/docs/checkouts/readthedocs.org/user_builds/datavizml/envs/latest/lib/python3.11/site-packages/pandas/core/arrays/timedeltas.py:912: RuntimeWarning: invalid value encountered in cast
  data = (base * m + (frac * m).astype(np.int64)).view("timedelta64[ns]")
sd.to_dict()
{'feature_name': 'time stamp',
 'feature_dtype': dtype('<M8[ns]'),
 'feature_score': 0.033686967797483,
 'feature_score_type': 'Inter-decile skew',
 'feature_transform': None,
 'feature_nunique': 442,
 'feature_missing_proportion': 0,
 'target_name': 'target',
 'target_dtype': Int64Dtype(),
 'target_score': 0,
 'target_score_type': 'PPS'}
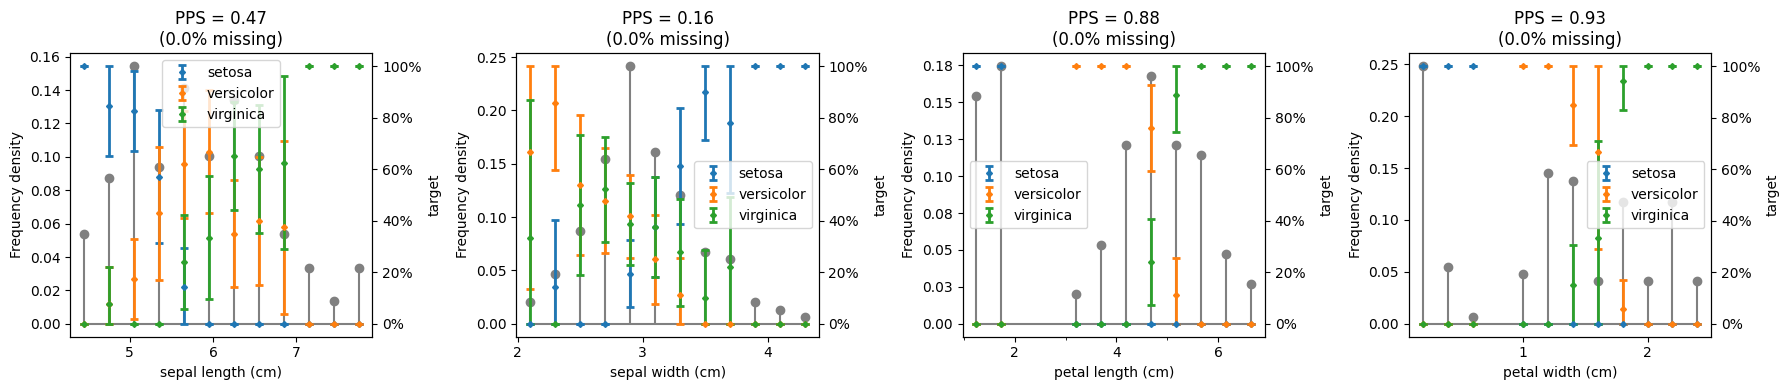
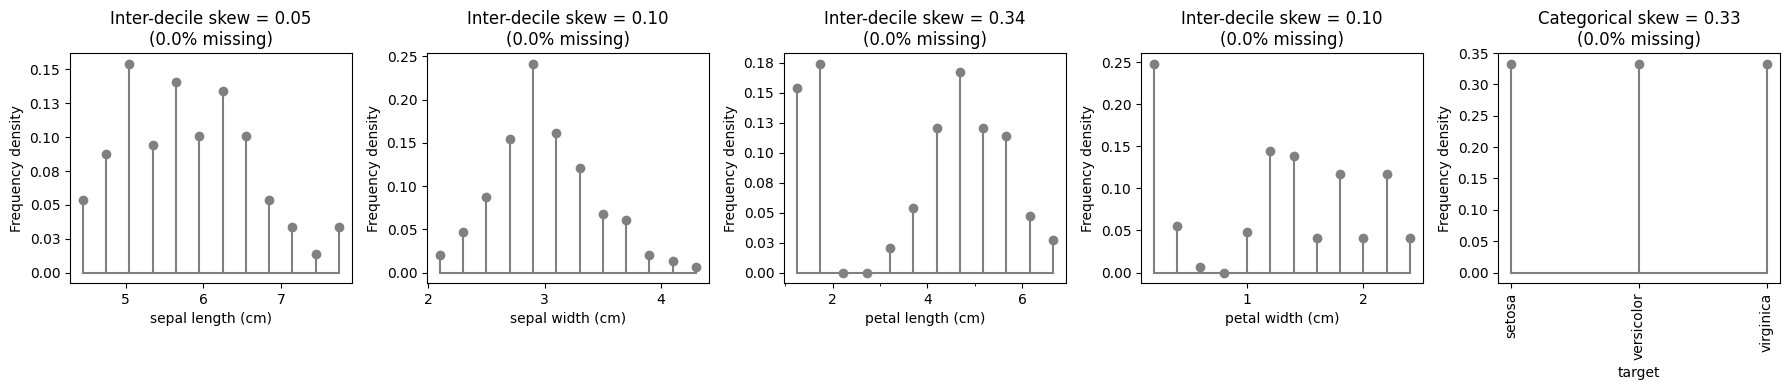
Demonstrate with multiclass classification
# create and run eda for data and target
eda = ExploratoryDataAnalysis(
    data=X_multiclass_classification,
    target=y_multiclass_classification,
    ncols=4,
    figure_width=18,
    axes_height=4,
)
fig = eda()

# set figure layout
fig.tight_layout()
eda.summary()
| feature_name | feature_dtype | feature_score | feature_score_type | feature_transform | feature_nunique | feature_missing_proportion | target_name | target_dtype | target_score | target_score_type | |
|---|---|---|---|---|---|---|---|---|---|---|---|
| 0 | sepal length (cm) | Float64 | 0.047619 | Inter-decile skew | None | 35 | 0 | target | string | 0.471649 | PPS |
| 1 | sepal width (cm) | Float64 | 0.099099 | Inter-decile skew | None | 23 | 0 | target | string | 0.156915 | PPS |
| 2 | petal length (cm) | Float64 | 0.340909 | Inter-decile skew | None | 43 | 0 | target | string | 0.884812 | PPS |
| 3 | petal width (cm) | Float64 | 0.100000 | Inter-decile skew | None | 22 | 0 | target | string | 0.927652 | PPS |
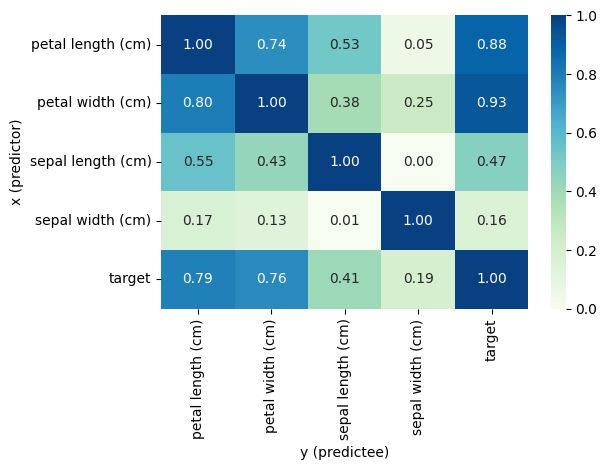
# create and run eda for data and target
eda = ExploratoryDataAnalysis(
    data=pd.concat([X_multiclass_classification, y_multiclass_classification], axis=1),
    ncols=5,
    prediction_matrix_full=True,
    figure_width=18,
    axes_height=4,
)
fig = eda()

# set figure layout
fig.tight_layout()
# plot prediction heatmap
fig, ax = plt.subplots()
eda.prediction_score_plot(ax=ax)
fig.tight_layout()
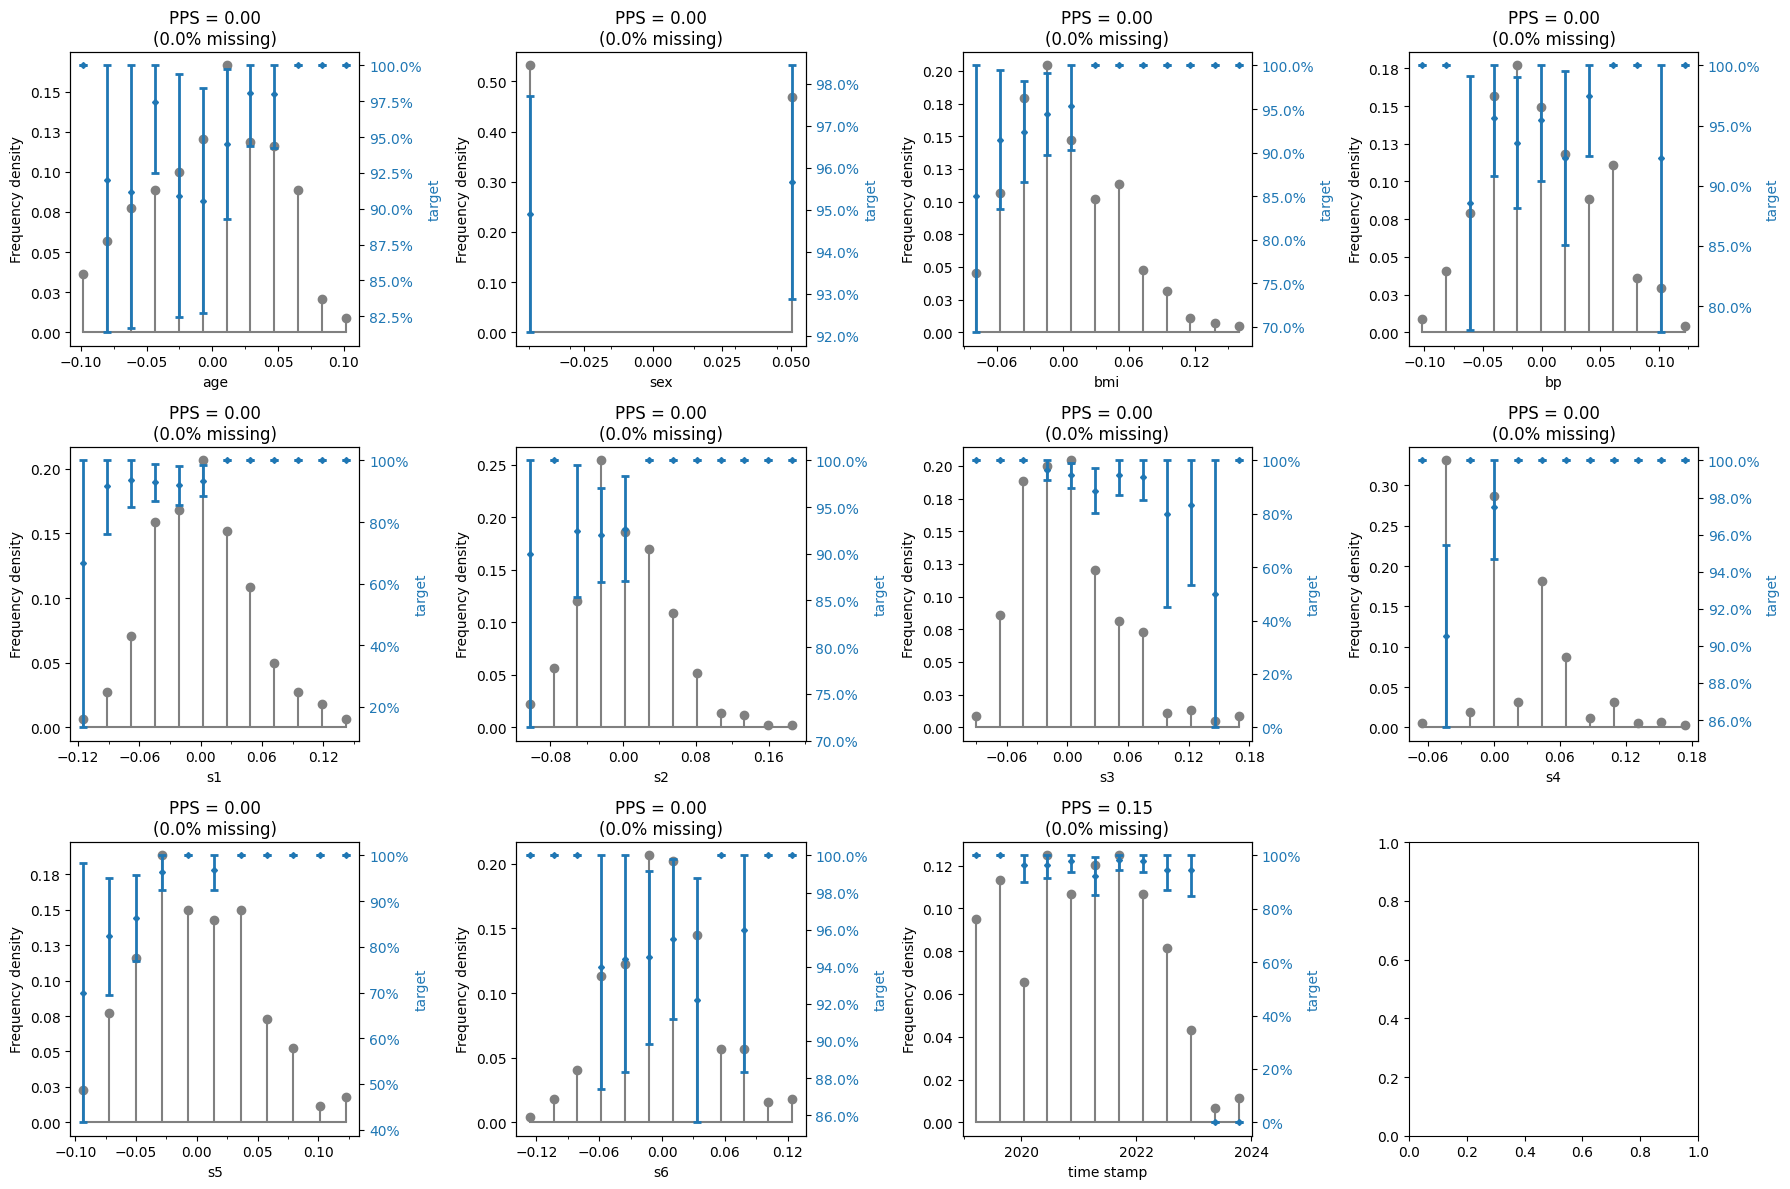
Demonstrate with imbalanced binary classification
# create and run eda for data and target
eda = ExploratoryDataAnalysis(
    data=X_regression,
    target=y_regression_class,
    ncols=4,
    figure_width=18,
    axes_height=4,
)
fig = eda()

# set figure layout
fig.tight_layout()

# display prediction matrix
eda.prediction_matrix
/home/docs/checkouts/readthedocs.org/user_builds/datavizml/envs/latest/lib/python3.11/site-packages/pandas/core/arrays/timedeltas.py:908: RuntimeWarning: invalid value encountered in cast
  base = data.astype(np.int64)
/home/docs/checkouts/readthedocs.org/user_builds/datavizml/envs/latest/lib/python3.11/site-packages/pandas/core/arrays/timedeltas.py:912: RuntimeWarning: invalid value encountered in cast
  data = (base * m + (frac * m).astype(np.int64)).view("timedelta64[ns]")
| x | y | ppscore | case | is_valid_score | metric | baseline_score | model_score | model | |
|---|---|---|---|---|---|---|---|---|---|
| 0 | age | target | 0.000000 | classification | True | weighted F1 | 0.929311 | 0.927036 | DecisionTreeClassifier() |
| 1 | sex | target | 0.000248 | classification | True | weighted F1 | 0.929311 | 0.929329 | DecisionTreeClassifier() |
| 2 | bmi | target | 0.000000 | classification | True | weighted F1 | 0.929311 | 0.923644 | DecisionTreeClassifier() |
| 3 | bp | target | 0.000000 | classification | True | weighted F1 | 0.929311 | 0.925905 | DecisionTreeClassifier() |
| 4 | s1 | target | 0.000000 | classification | True | weighted F1 | 0.929311 | 0.907689 | DecisionTreeClassifier() |
| 5 | s2 | target | 0.000000 | classification | True | weighted F1 | 0.929311 | 0.911806 | DecisionTreeClassifier() |
| 6 | s3 | target | 0.000000 | classification | True | weighted F1 | 0.929311 | 0.921330 | DecisionTreeClassifier() |
| 7 | s4 | target | 0.000000 | classification | True | weighted F1 | 0.929311 | 0.928198 | DecisionTreeClassifier() |
| 8 | s5 | target | 0.000000 | classification | True | weighted F1 | 0.929311 | 0.910487 | DecisionTreeClassifier() |
| 9 | s6 | target | 0.000248 | classification | True | weighted F1 | 0.929311 | 0.929329 | DecisionTreeClassifier() |
| 10 | time stamp | target | 0.150660 | classification | True | weighted F1 | 0.929311 | 0.939961 | DecisionTreeClassifier() |
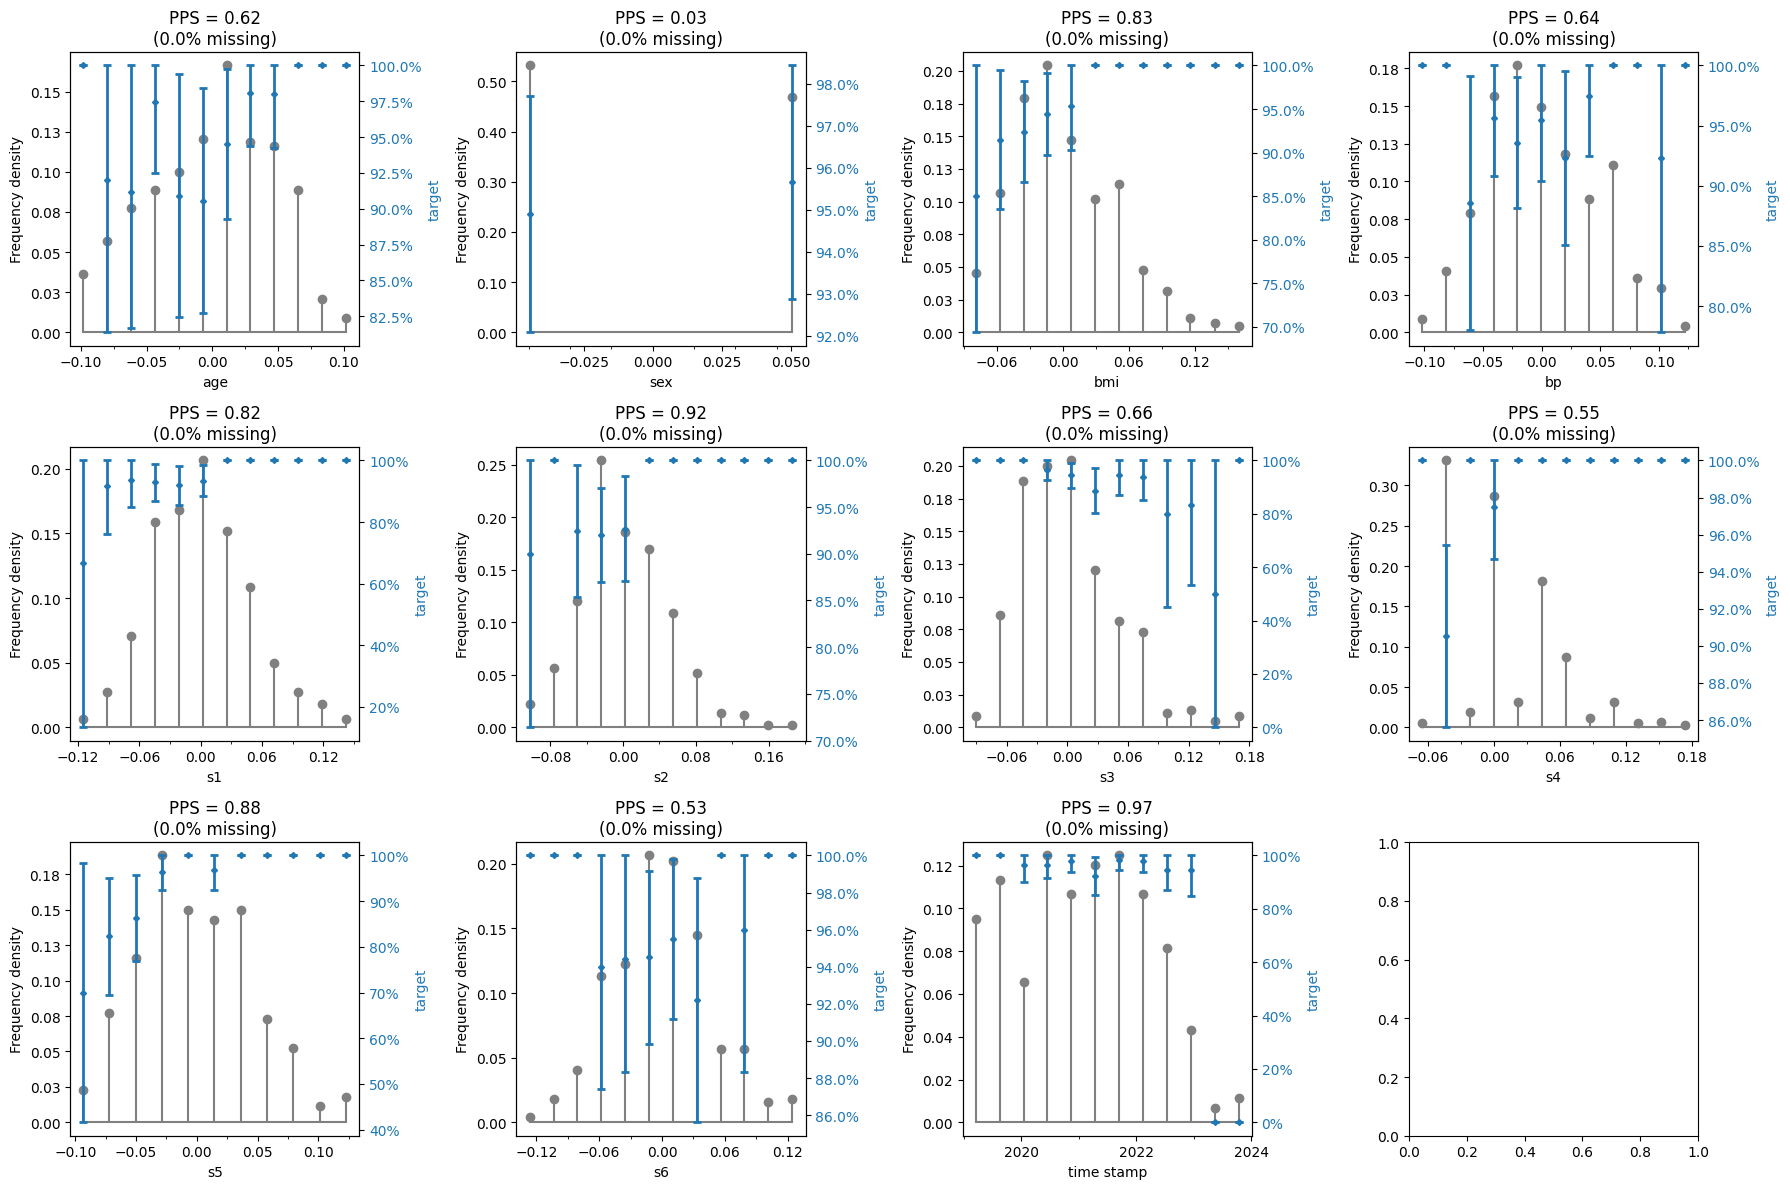
# create and run eda for data and target
eda = ExploratoryDataAnalysis(
    data=X_regression,
    target=y_regression_class,
    target_rebalance=True,
    ncols=4,
    figure_width=18,
    axes_height=4,
)
fig = eda()

# set figure layout
fig.tight_layout()

# display prediction matrix
eda.prediction_matrix
/home/docs/checkouts/readthedocs.org/user_builds/datavizml/envs/latest/lib/python3.11/site-packages/pandas/core/arrays/timedeltas.py:908: RuntimeWarning: invalid value encountered in cast
  base = data.astype(np.int64)
/home/docs/checkouts/readthedocs.org/user_builds/datavizml/envs/latest/lib/python3.11/site-packages/pandas/core/arrays/timedeltas.py:912: RuntimeWarning: invalid value encountered in cast
  data = (base * m + (frac * m).astype(np.int64)).view("timedelta64[ns]")
| x | y | ppscore | case | is_valid_score | metric | baseline_score | model_score | model | |
|---|---|---|---|---|---|---|---|---|---|
| 0 | age | target | 0.616447 | classification | True | weighted F1 | 0.505351 | 0.810276 | DecisionTreeClassifier() |
| 1 | sex | target | 0.027742 | classification | True | weighted F1 | 0.505351 | 0.519073 | DecisionTreeClassifier() |
| 2 | bmi | target | 0.827911 | classification | True | weighted F1 | 0.505351 | 0.914876 | DecisionTreeClassifier() |
| 3 | bp | target | 0.644764 | classification | True | weighted F1 | 0.505351 | 0.824283 | DecisionTreeClassifier() |
| 4 | s1 | target | 0.820698 | classification | True | weighted F1 | 0.505351 | 0.911308 | DecisionTreeClassifier() |
| 5 | s2 | target | 0.920560 | classification | True | weighted F1 | 0.505351 | 0.960705 | DecisionTreeClassifier() |
| 6 | s3 | target | 0.661226 | classification | True | weighted F1 | 0.505351 | 0.832426 | DecisionTreeClassifier() |
| 7 | s4 | target | 0.553270 | classification | True | weighted F1 | 0.505351 | 0.779025 | DecisionTreeClassifier() |
| 8 | s5 | target | 0.879351 | classification | True | weighted F1 | 0.505351 | 0.940321 | DecisionTreeClassifier() |
| 9 | s6 | target | 0.534821 | classification | True | weighted F1 | 0.505351 | 0.769900 | DecisionTreeClassifier() |
| 10 | time stamp | target | 0.968737 | classification | True | weighted F1 | 0.505351 | 0.984536 | DecisionTreeClassifier() |
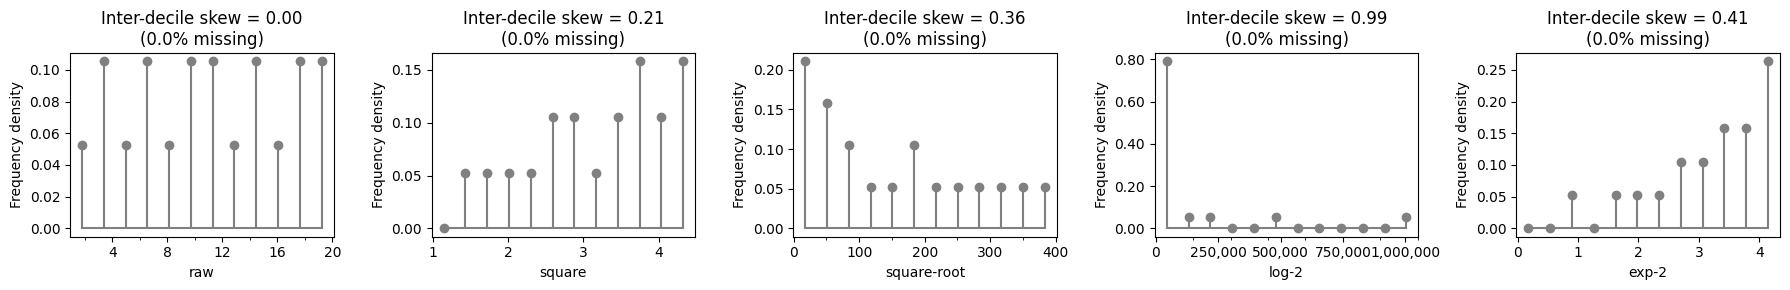
Demonstrate transformation options
raw = [1, 2, 3, 4, 5, 6, 7, 8, 9, 10, 11, 12, 13, 14, 15, 16, 17, 18, 19, 20] * 100
data_transform = pd.DataFrame(
    {
        "raw": raw,
        "square": np.sqrt(raw),
        "square-root": np.square(raw),
        "log-2": np.exp2(raw),
        "exp-2": np.log2(raw),
    }
)
# create and run eda for data and target
eda = ExploratoryDataAnalysis(
    data=data_transform,
    ncols=5,
    figure_width=18,
    axes_height=3,
)
fig = eda()

# set figure layout
fig.tight_layout()
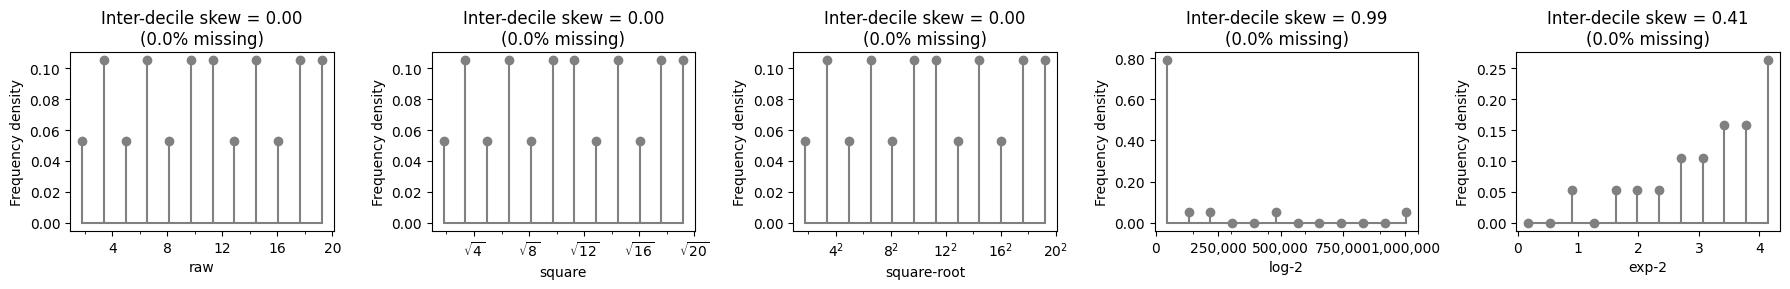
# create and run eda for data and target
eda = ExploratoryDataAnalysis(
    data=data_transform,
    ncols=5,
    data_deskew=["square", "square-root"],
    figure_width=18,
    axes_height=3,
)
fig = eda()

# set figure layout
fig.tight_layout()
# create and run eda for data and target
eda = ExploratoryDataAnalysis(
    data=data_transform,
    ncols=5,
    data_deskew=True,
    figure_width=18,
    axes_height=3,
    metric="count",
)
fig = eda()

# set figure layout
fig.tight_layout()
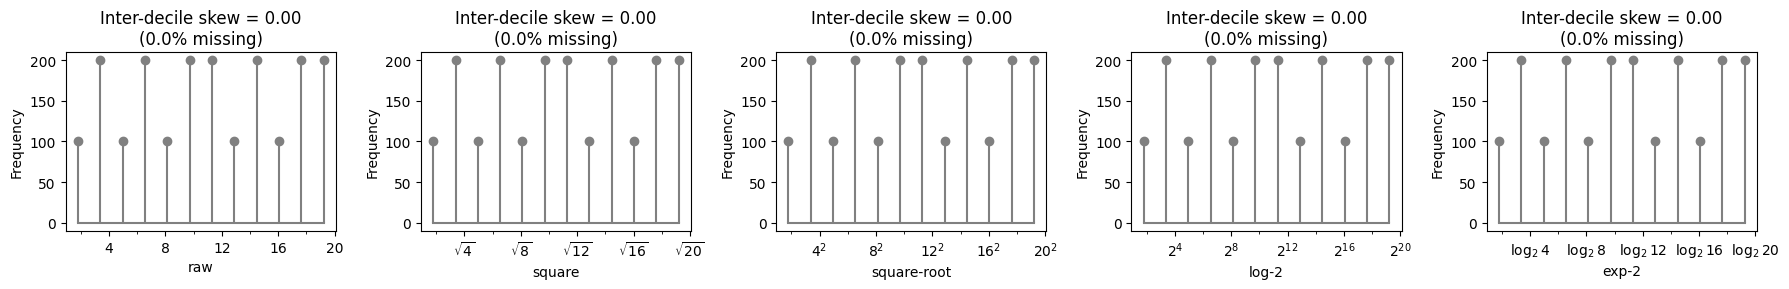
eda.summary()
| feature_name | feature_dtype | feature_score | feature_score_type | feature_transform | feature_nunique | feature_missing_proportion | target_name | target_dtype | target_score | target_score_type | |
|---|---|---|---|---|---|---|---|---|---|---|---|
| 0 | raw | Int64 | 9.349247e-15 | Inter-decile skew | None | 20 | 0 | None | None | NaN | N/A |
| 1 | square | Float64 | 9.115515e-15 | Inter-decile skew | square | 20 | 0 | None | None | NaN | N/A |
| 2 | square-root | Int64 | 9.349247e-15 | Inter-decile skew | square-root | 20 | 0 | None | None | NaN | N/A |
| 3 | log-2 | Int64 | 9.349247e-15 | Inter-decile skew | log-2 | 20 | 0 | None | None | NaN | N/A |
| 4 | exp-2 | Float64 | 9.576338e-15 | Inter-decile skew | exp-2 | 20 | 0 | None | None | NaN | N/A |